Engulfing candlestick patterns are comprised of two bars on a price chart. They are used to indicate a market reversal. The second candlestick will be much larger than the first, so that it completely covers or ‘engulfs’ the length of the previous bar. There are two types:
- Bullish engulfing candlestick patterns
- Bearish engulfing candlestick patterns
They can indicate that the market is about to change direction after a previous trend. Whether this is bullish or bearish signal will depend on the order of the candles.
The body of a candlestick represents the open-to-close range of each trading period, which can range from a second to a month or more – depending on your chart settings. Looking at two bars next to each other will provide a clear comparison of the market movement from one period to the next. The colour of the candle will indicate whether the price direction has been up (green) or down (red).
For a perfect engulfing candle, no part of the first candle can exceed the wick (also known as the shadow) of the second candle. This means that the high and low of the second candle covers the entirety of the first one. However, the main focus is on the real body of the candle.
Engulfing candles are one of the most popular candlestick patterns, used to determine whether the market is experiencing upward or downward pressure. However, it is important to remember that engulfing candles are a lagging technical indicator – meaning they occur after price action – as they require the previous two candlesticks’ worth of data before the signal is given.
Bullish engulfing candles
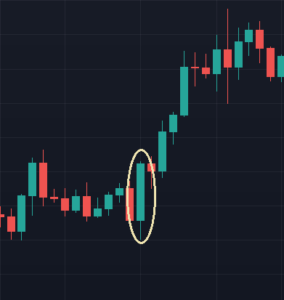
A bullish engulfing pattern appears in a downtrend. It is formed of a short red candle next to a much larger green candle.
The first candlestick shows that the bears were in charge of the market. Although the second period opens lower than the first, the new bullish pressure pushes the market price upwards – often to such an extent the second candle is twice the size of the previous one.

Bearish engulfing candles
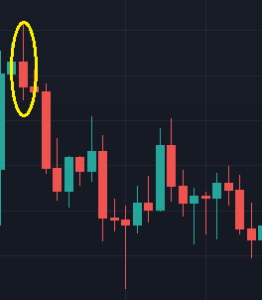
A bearish engulfing pattern is the opposite of a bullish engulfing; it comprises of a short green candle that is completely covered by the following red candle.
The first candlestick shows that the bulls were in charge of the market, while the second shows that bearish pressure pushed the market price lower. The second period will open higher than the previous day but finish significantly lower.

Bullish and bearish engulfing candlestick patterns summed up
- Engulfing candlestick patterns are comprised of two bars on a price chart
- They are used to indicate a market reversal
- The second candlestick will be much larger than the first, so that it completely covers or ‘engulfs’ the length of the previous bar
- A bullish engulfing pattern will be made of a shorter red bar being engulfed by a longer green bar. This indicates a bearish trend is coming to an end, ready for an uptrend
- A bearish engulfing pattern will be made of a shorter green bar being engulfed by a longer red bar. This indicates a bullish trend is coming to an end, ready for a downtrend
- They are a common part of a forex trading strategy
- Engulfing candlesticks are a lagging indicator, meaning they give the signal to enter a trade after the price movement has occurred

