Fibonacci can be used as a tool in the markets by taking two extreme points. These levels are normally the high and the low of a stock or Forex pair. The vertical distance is then divided into the key Fibonacci ratios. The key levels traders concentrate on when trading the markets are the 50% and 61% levels.
This theory states that the move higher or lower is more likely to continue and reach the recent highs or lows if price has moved strongly past the 50% level. The 50% level also acts as a major psychological level, in the same way that major support and resistance levels and Very Big Round Numbers do especially when combined.
The 50% level is a very popular level and this is why traders will find the 50% level on their Fibonacci tool. Fibonacci retracements are often used as part of a trend-trading strategy. In this scenario, traders observe a retracement taking place within a trend and try to make low-risk entries in the direction of the initial trend using Fibonacci levels. Traders using this strategy anticipate that a price has a high probability of bouncing from the Fibonacci levels back in the direction of the initial trend.
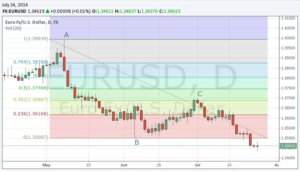
For example, on the EUR/USD daily chart below, we can see that a major downtrend began (point A). The price then bottomed (point B) and retraced upward to approximately the 38.2% Fibonacci retracement level of the down move (point C).

In this case, the 38.2% level would have been an excellent place to enter a short position in order to capitalize on the continuation of the downtrend that started in May. There is no doubt that many traders were also watching the 50% retracement level and the 61.8% retracement level, but in this case, the market was not bullish enough to reach those points. Instead, EUR/USD turned lower, resuming the downtrend movement and taking out the prior low in a fairly fluid movement.
Fibonacci retracement levels often indicate reversal points with uncanny accuracy. However, they are harder to trade than they look in retrospect. These levels are best used as a tool within a broader strategy. Ideally, this strategy is one that looks for the confluence of several indicators to identify potential reversal areas offering low-risk, high-potential-reward trade entries.
Fibonacci trading tools however, tend to suffer from the same problems as other universal trading strategies, such as the Elliott Wave theory. That said, many traders find success using Fibonacci ratios and retracements to place transactions within long-term price trends. Fibonacci retracement can become even more powerful when used in conjunction with other indicators or technical signals.

