Let’s say an analyst is looking at a 1-day chart of the EUR/USD pair, and they apply 10-period moving averages. The analyst gets a line representing the average of the past 10 closing daily prices plotted over the current price. This smooths out the jagged peaks and troughs to provide a clearer idea of the general trend, stripped of all that short term ‘noise.’
Exponential moving averages or EMAs is nearly the same thing, just a little more complicated. EMAs react faster to unexpected moves by putting more emphasis or ‘weight’ to more recent closing prices. Therefore, it follows the current price more closely compared to SMAs.
Now, some famous averages include 10, 20, 50, 100, and 200-period moving averages. The higher the number of periods factored in the calculation, the flatter the line is, the slower it will respond to changes in price, and the longer it will trend.

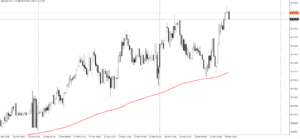
200 moving average on NZDUSD pair

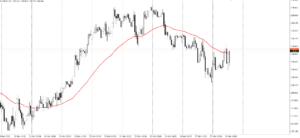
50 moving average on GBPJPY pair
Simple Strategy
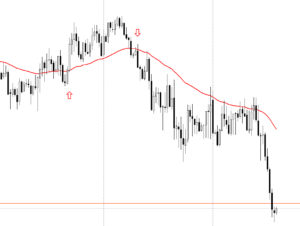
Now, the simplest kind of moving average strategy is to purchase if the price goes across the moving average from under to above and to sell as it crosses it from above to below. Several strategies indicate that you must get a close above or below the given moving average to make the buy or sell signal valid. As this might look too simple to yield any real benefits, this could be a great and effective indicator in some markets.
Then, longer-term moving averages can also be used to signal changes in trend – for example, if a bull market did not find support above a moving average or if a bear market break resistance above it.

For Crossovers
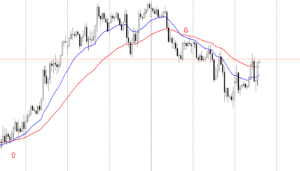
Furthermore, a more complex type of moving average strategy is plotting two moving averages – one short and one long (like a 20-day period and a 50-day period). As mentioned, a shorter moving average will react faster to current changes in price as it takes lesser closing prices into account in the calculation.
The longer moving average will then react slower as it’s average more closing prices from further back. And that means all current closing prices will have less of an effect on the entire average.
For using multiple moving averages, technical analysts are looking for the so-called crossovers. Rather than searching for the price action to close above or below a single moving average line, they look at the interaction among the two moving averages they plotted. With that, as the 20-day MA crosses over the 50-day MA, it is considered a bullish cross. But when it crosses under it, it is regarded as a bearish cross.

Major Concerns
There are some significant issues in depending exclusively on strategies structured around moving averages. First, moving average strategies are hugely vulnerable to fakeouts. Seldomly, the price could break convincingly above or below a moving average – giving buy or sell signals, only to reverse again and continue trading in the reverse direction.
Second, moving averages are most helpful if the market is trending strongly in a single direction. The 20-week strategy has historically worked well because Bitcoin has experienced some strong and clearly defined bull and bear markets. Meanwhile, if the price action looks choppy instead of strong trending, moving averages will provide a lot of false buy and sell signals that don’t yield any real gains and mostly affect churning the account.
Third and last issue, moving averages necessarily lag behind the price action as they are completely based on averaging-out previous prices. The said lag might be more pronounced while they employ crossovers strategies because these depend on the position of one moving average in relation to another. Also, these move slower compared to the actual price.

