The Ichimoku Kinko Hyo (meaning ‘’One look equilibrium chart”) otherwise known as the Ichimoku Cloud or simply just Ichimoku is an incredibly versatile indicator that in the right hands can provide a trader with support and resistance, trend direction, momentum and even trading signals. This indicator is the most popular indicator among Japanese Traders of all markets and was created by Journalist Goichi Hosoda in 1968 then published in his book in 1969, however he reportedly first began creating this indicator in the late 1930’s.

Chikou Span (Green line)
The Chikou Span or lagging span, is the current price shifted to the left by 26 periods, this is default but can be altered for different strategies and/or preferences.
Tenkan-Sen (Blue line)
The Tenkan-Sen referred to as the conversion line, is calculated using the midpoint of the highest high and the lowest low over 9 periods. The Tenkan-Sen is used with the Kijun-Sen to predict future momentum. A buy signal is generated when the Tenkan-Sen moves above the Kijun-Sen indicating momentum is moving bullishly, a sell signal is generated when the Tenkan-Sen moves below the Kijun-Sen indicating momentum is moving bearishly.
Kijun-Sen (Red line)
The Kijun-Sen referred to as the base line, is similar to the Tenkan-Sen, but is calculated using the midpoint between 26 periods as opposed to 9. Kijun-Sen and Tenkan-Sen lines also act as support and resistance lines during trends.
Senkou Span (The Cloud/Kumo)
The Senkou Span ‘’Cloud’’ or ‘’Kumo’’ is made up of two lines and the space in-between, which depending on your platform will normally go green for a bullish trend and red for a bearish trend. The two lines are ‘’Senkou Span A’’ and ‘’Senkou Span B’’. The cloud identifies long term trend direction, it is recommended to trade with the direction of the cloud.
Senkou Span A
The Senkou Span A line is calculated using the midpoint between the Tenkan-Sen and Kijun-Sen lines and then shifted right by 26 periods, so it is leading and forms the faster cloud boundary. When this line crosses below Senkou Span B this indicates a bearish trend and this is when the cloud will go red.
Senkou Span B
The Senkou Span B line is the midpoint of the 52-period high and the 52-period low, this line is also shifted right by 26 periods and forms the slower cloud boundary.
How to Trade the Ichimoku breakout

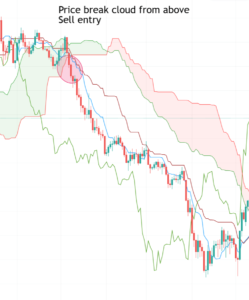
The chart begins with the price action moving below the cloud. This gives a sell signal on the chart and an Ichimoku trader would be looking to short the Cable. The price enters a bearish trend afterwards. The decrease is relatively sharp. On the way down the price action creates a few corrective moves.

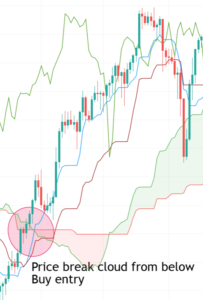
The chart image starts with the price breaking out of the Cloud in a bullish direction. The red circle shows the moment when the price closes a candle above the Cloud. This is the buy signal traders need in order to go long the EUR/USD Forex pair. The price starts trending upwards shortly afterwards.
The Ichimoku is an amazing all in one indicator that truly lives up to being a ‘’one look’’ indicator. Once a trader gets over the initial overload of first seeing the indicator, it becomes easily understood and easily used to identify momentum, trading signals, support and resistance and long term trend direction.

