the principle behind the momentum indicator is that as an asset is traded, the speed of the price movement reaches a maximum when the entrance of new investors or money into a particular trade is at its peak. When there is less potential new investment available, the tendency after the peak is for the price trend to flatten or reverse direction.
The direction of momentum is customarily determined using closing prices in the following formula:
Momentum = Current Price – Previous Price
A positive result is a signal of positive momentum, while a negative result is a signal of a negative momentum.
This indicator is normally used with a rate-of-change indicator, or ROC, which divides the momentum result by an earlier price. Multiplying this total by 100, traders can find a percentage rate of change to plot peaks and troughs in price trends. This percentage can vary from a lower limit of -100% up to 100% or more. Generally, as the rate of change approaches one of these extremes, there is an increasing chance the price trend will reverse directions.
Some other well-known oscillators among trading tools include the Stochastic Oscillator, the Relative Strength Index, Moving Average Convergence Divergence and the Commodity Channel Index. Additionally, many other oscillator innovations and variations on existing tools have been developed by analysts and private trading entities.
Stochastic
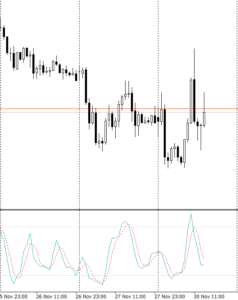
The Stochastic Oscillator is a measurement that compares an asset’s price to its price range over a specified period of time. The stochastic was developed in the 1950s by George Lane. The term stochastic originally came from statistics and related to probability of random distribution. The stochastic oscillator indicator is customarily represented by the symbol %K, found by the formula:
%K = (Closing Price – Low in Range)/(High in Range – Low in Range) × 100
There are differing types of stochastics whose oscillations are smoothed according to simple moving averages. The stochastic oscillators are customarily plotted as two lines on a graph, commonly known as the fast line and the slow line.
Analysts compare the movement of the lines to look for crossovers that reveal buy signals, divergences that can indicate price reversals, and highs and lows on the chart that show overbought or oversold conditions.

Stochastic oscillator
RSI
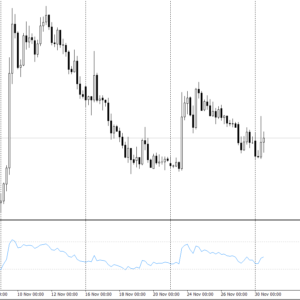
The Relative Strength Index (RSI) analyses recent price gains and losses and compares them to the current price to assess whether a currency pair is at a fair value. The index was developed by Welles Wilder in 1978. The RSI is plotted on a scale of 0-100 with positioning near the high and low ends of the scale signaling the market for a particular asset is at overbought or oversold conditions.
The indicator is expressed by RSI = 100 – 100/(1 + RS). RS is the average number of sessions when the price ended higher, divided by the average number of sessions when it ended lower. The results of the indicator can be skewed by large spikes or dips in prices and thus it is best used in tandem with other indicators that reveal trend or buy and sell signals.

RSI oscillator
MACD
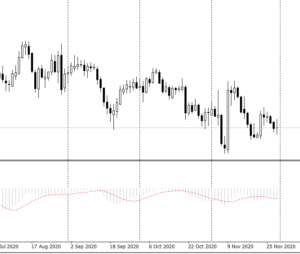
The Moving Average Convergence/Divergence Oscillator, known as MACD, plots the distance between moving averages to determine the direction, strength and momentum of price changes. The indicator, developed by Gerald Appel in the 1970s, is used to help predicting ideal entry or exit points for a trade.
The MACD compares a 12-day exponential moving average with a 26-day exponential average. Like other oscillators, it reveals buy and sell signals and momentum, in addition to trends through crossovers, divergences and highs and lows in trend lines.

MACD oscillators
CCI
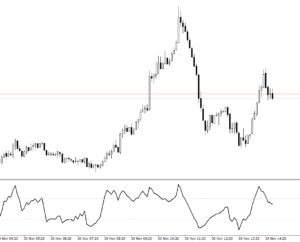
The Commodity Channel Index, or CCI, is an indicator that measures the current price level relative to an average price level over a given period of time. It was originally developed by Donald Lambert in 1980 to identify cyclical changes in commodities prices, but it has since been applied to other asset classes, including currencies.
The Commodity Channel Index is expressed by the formula: CCI = (Typical Price – 20-period SMA of TP) / (.015 x Mean Deviation), where the typical price (TP) = (High + Low + Close)/3, and .015 is a constant.
The index is charted within a range from -100 to 100. Like other oscillators, when the trend line on the CCI index nears an extreme of the range, it can help traders identify peaks or troughs in an asset’s price. It can also locate ideal entrance or exit levels for trading.

CCI oscillator
The Momentum indicator is regarded as an excellent gauge of market strength. A shorter period setting will create a more sensitive indicator, but will also increase choppiness and the potential for increased false signals.

