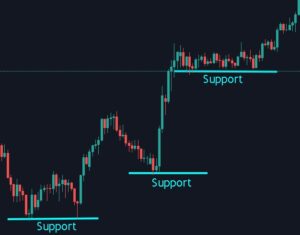
Support is a price level where a downtrend can be expected to pause due to a concentration of demand. When the price of an asset or currency drops, there are more and more buyers that are willing to purchase that asset as the price lowers. That increase in demand as the price falls creates “support”, as buy orders are placed around the lower price levels.

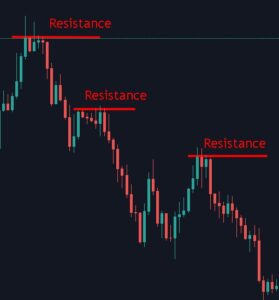
Conversely, resistance is a price level where an uptrend can be expected to pause due to a concentration of sell orders at that price level.
Support and resistance can be determined in many different ways. You can identify support and resistance levels through backtesting- looking at the historical price movements to see where the price has faltered (hit resistance) or where the price has bounced upward from (hit support).
When practicing technical analysis, a support or resistance line can be draw when the trend line hits at least 3 candlesticks (if resistance, the top of the candlestick, if support, the bottom).


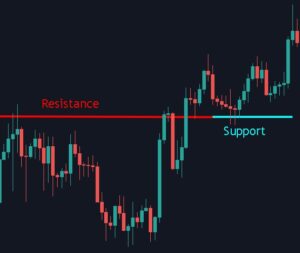
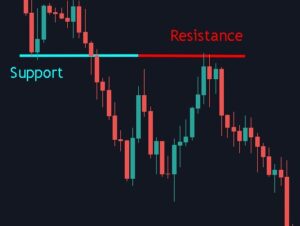
Support can also turn into resistance if a price falls below it, or “breaks support”. If a price level falls below a support line, that means the demand for the asset at that price wasn’t strong enough to keep the support intact, and the people who placed their buy orders are now stuck in positions at a loss.
