Whether the change in direction is a simple retracement, or pullback, or the sign of a more significant trend reversal usually depends on the timeframe being traded and other technical analysis such as whether the asset is trading around historic levels of support or resistance. There are several types of divergences to know about, Bullish divergence and Bearish divergence.
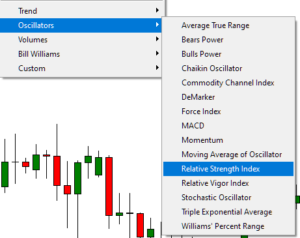
To start with, a trader needs to identify which technical indicators they will use to identify divergence. There are many different types of technical indicators that are available. The most common indicators are in the category called ‘Oscillators’. In your MetaTrader 4 trading platform (it is also available in the MetaTrader 5 trading platform) there are a variety of different oscillators you can use, as shown below.

Bullish divergence
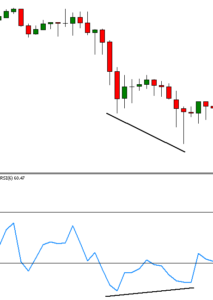
Bullish divergences are used to trade the change in direction from a downwards move to an upwards move. They occur when price cycles create a lower low and at the same time, a technical indicator is making a higher low. In essence, the indicator is not following the price down, suggesting the move lower is weakening and losing momentum, resulting in a possible move higher.

In the example above, price cycles have made a lower low, while at the same time the technical indicator – which is the Relative Strength Index (RSI,6) in this example – has not followed price down and has made a higher low. Traders would take this as a sign that the sellers driving the market lower are weak, allowing the opportunity for buyers to step in and take control. Usually, traders would combine this analysis with other technical analysis indicators or price action.
Bearish divergence
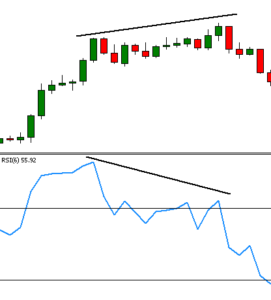
Bearish divergences are used to trade the change in direction from an upwards move to a downwards move. They occur when price cycles create a higher high and at the same time, a technical indicator is making a lower high. In essence, the indicator is not following the price up, suggesting the move higher is weakening and losing momentum, resulting in a possible move lower.

In the example above, price cycles have made a higher high, while at the same time the technical indicator – which is the Relative Strength Index (RSI,6) in this example has not followed price higher and has made a lower high. Traders would take this as a sign that the buyers driving the market higher are weak, allowing the opportunity for sellers to step in and take control. Usually, traders would combine this analysis with other technical analysis indicators.

