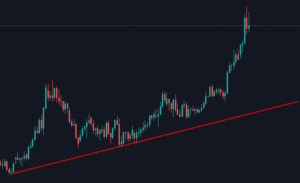
Upward trend
An upward trend line may be drawn by adjoining two successive price lows and can be validated to be a price trend if more than 2 successive lowest lows can be adjoined by a straight line. In simple words, the trend line will always be drawn underneath the geometric patterns exhibited by price movements on a trading chart.

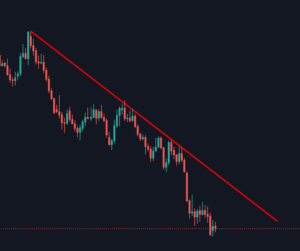
Downward trend
Similarly, a downward trend line can be drawn by adjoining two and more consecutive highest highs of the price movement. Here, the trend line will be drawn above the geometric patterns exhibited by price movements connecting each price high.

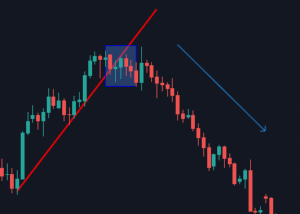
When a particular trend line breaks into a new direction, it indicates a trend reversal. Simply put, in the figure below, an upward trend line will reverse the moment the price behavior pattern lies below the trend line. However, a trend reversal is not always necessarily an indication from the trend line when it merely pierces through a price pattern.

Furthermore, in certain cases the market price exhibits a sideways trend i.e. when the price tends to neither rise nor fall intensively resulting in the geographic patterns channeled on a horizontal line.
Support & Resistance in a trend line
In the case of an upward trend, the trend line will indicate a support force owing to the rising demand while even the prices rise, spurred by precedented market price behavior. Every successive upward move of the trend line acts as a support until the point where the trend line is broken which is when the market price becomes resistance. The moment the trend line shows a descending trend, it triggers massive selling of the underlying currency pair and the increasing supply makes the market bearish.
Trend lines assist traders extensively in deciding, timing and executing their trade while also minimizing risks if these are charted right. A trader ideally buys at the point of a dip in prices during an upward trend i.e. when the prices touch the trend line and engages in selling when the price movement patterns rise in a downward trend. Trend line analysis is also instrumental to identifying and planning entry or exit points in a particular trade by making calculated guesses around the price action exhibited on and around the trend line.
Trend line analysis however suffers from the standpoint of time since a trader needs to be able to assimilate immediate, medium-term and long term price movement trends to be able to make a justifiably accurate trading decision. An intra-day price chart may indicate a different price action trend than a daily or even a weekly price action chart. However, in practice it has been observed that taking into account the immediate and medium-term trends allow traders to choose the right action. Trend line analysis has become a necessity in forex and technical analysis for obvious reasons. However, experienced traders hone themselves gradually to undertake trend line analysis instinctively in their mind by merely looking at a price action chart.

